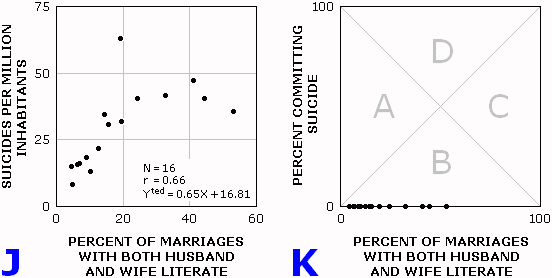
Display 5-14. Alternative portrayals of an ecological correlation between literacy and suicide over 16 Italian provinces (Durkeim, 1897/1951, p. 164). The Goodman square in Graph K reveals that all the data fall into Triangle B, and furthermore that the data points effectively fall on the X-axis, a configuration which, though yielding a very precise estimate of the individual correlation, is unhelpful because that estimate spans zero. |
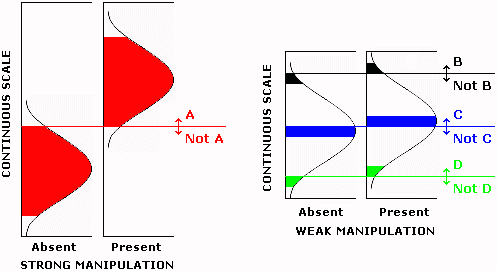
Display 6-3. Graphic presentation of a can cross region in the case of a strong manipulation on the left, and for alternative cutting points in the case of a weak manipulation on the right. |
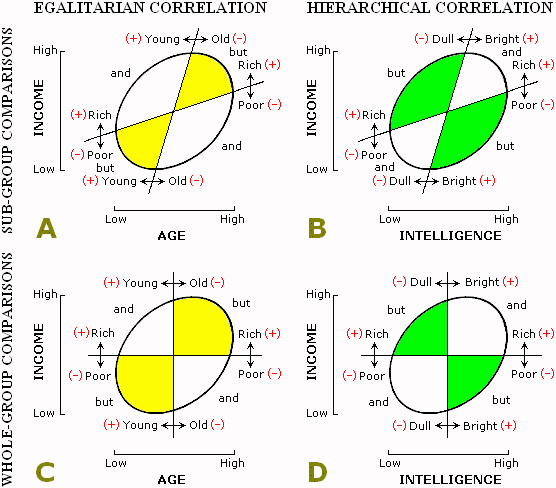
Display 7-2. In egalitarian correlations (the scatterplot extends from one but region to another), regions of incongruity increase when comparisons are whole-group. In hierarchical correlations (the scatterplot extends from one and region to another), regions of incongruity increase when the comparisons are sub-group. |
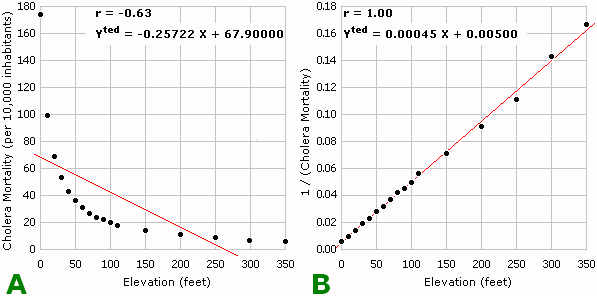
Display 8-8. Data from Farr (1852) demonstrate that the correlation coefficient computed when the underlying relation is non-linear (Graph A) is deflated in comparison to the correlation coefficient when one of the variables is transformed so as to make the relationship linear (Graph B). |